Grafana blank graphs in dashboards after update

Upgrading Grafana (kube-prometheus-stack) from version 23.1 to the latest one currently 44.2.1 results in many Grafana graphs to disappear from the existing dashboards.

Since editing the actual graphs and trying to use ‘Run queries’ does not seem to work, a work around is the following:

  • Edit the blank graph.
  • Add a new query (B) – even empty is fine
  • Use the ‘Run queries’ (it does not matter if you use the button on the original one or in the new query B)
  • Delete the new query B
  • The graph should appear again, so use the ‘Apply’ button on top right.
  • Repeat the process for any additional graphs in the dashboard
  • When you finish ‘Save’ the dashboard
  • The dashboard should be working again
Adding a LOKI report in Grafana counting number of http_user_agents from NGINX logs

To add a Loki report in Grafana, as for example having a count of the different http_user_agents that have logged in, you can use the following query:

count by (http_agent) (rate({namespace="ingress-nginx",stream="stdout"} |= "https://domain.name.com/session/new" |~ "GET\\s/\\s" | pattern "<ip> - - [<timestamp>] \"<method> <path> <version>\" <result> <_> \"<url>\" \"<http_agent>\" <_>" [$__interval]))

You select the source (Loki) and then use the {namespace=”ingress-nginx”,stream=”stdout”} to get the log files from Nginx.

Then you can filter by two conditions:

  1. the instance login
|= "https://domain.name.com/session/new"

and

  1. use the regular expression to only select the GET / calls
|~ "GET\\s/\\s"

Then you can use the pattern parser for the log file in order to get the label

pattern "<ip> - - [<timestamp>] \"<method> <path> <version>\" <result> <_> \"<url>\" \"<http_agent>\" <_>"

<_> is used if we are not interested in getting the field, so everything after http_agent is not analyzed in this case.

Finally use the

count by(http_agent) 

to get the data (note that you also need to use the rate with the [$__interval])

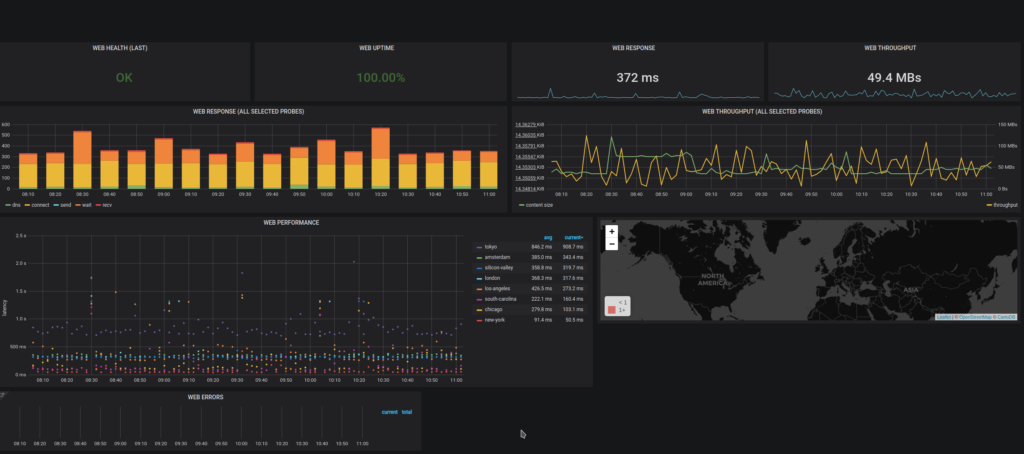
Setting up worldPing with Grafana running in docker

You would like to test worldPing (https://worldping.raintank.io/worldping/) in your local environment for evaluation purposes.

  • Install Grafana with docker as described here (https://grafana.com/docs/grafana/latest/installation/docker/) and give it a name (ie grafana)
  • Login to the grafana container and install the worldPing plugin:
$ docker exec -it grafana /bin/bash
bash-5.0$ grafana-cli plugins install raintank-worldping-app
  • Exit from the container and stop and start it
bash-5.0$ exit
$ docker stop grafana
$ docker start grafana
  • Login to your grafana installation on the browser (localhost:3000) and go to the section for the plugins to find worldPing
  • To be able to enable it you will need an API key from Grafana Cloud, so create a free account (https://grafana.com/signup/starter/connect-account)
  • Create an API key (Security – API Keys – Add API Key)
  • Go back to Grafana web UI and add the API key so you can enable the worldPing. Add an endpoint to check and select the services to check (DNS, Ping, HTTP, HTTPS)
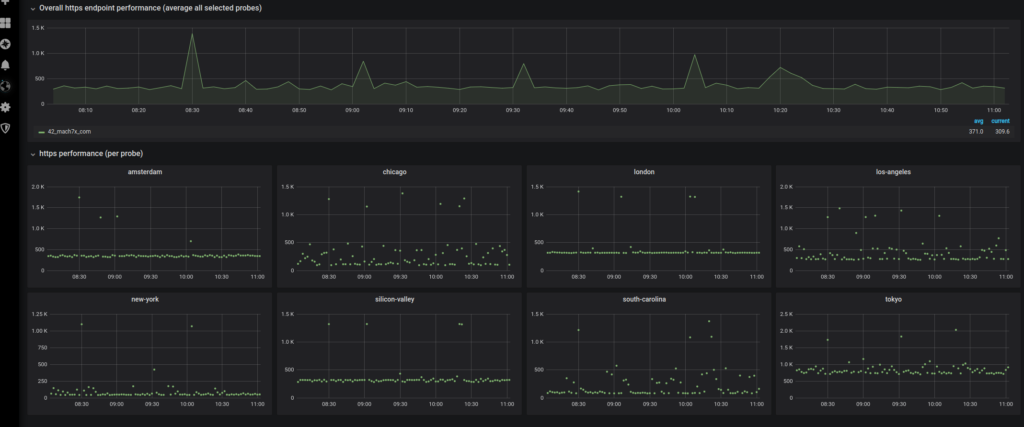
  • Leave it running for a few minutes and check the dashboards afterwards.
  • Remember to Disable if you want to go back to it again in the near future, or Destroy the endpoint if you do not need it anymore.

Grafana with github authentication problem

Problem

You are trying to use the github OAuth authentication for having users login to your Grafana but there is an error that redirect_uri must match that is coming from Github.

Solution

Make sure that you add a line with the root_url in your /etc/grafana/grafana.ini file that has the same IP/domain name as your server, and restart the service.

root_url = http://xxxx.xxxx.xxxx.xxxx:3000